sugar.imaging package
sugar.imaging – Plotting alignments
- sugar.imaging.alignment.plot_alignment(seqs, fname=None, *, ax=None, figsize=None, extent=None, aspect=None, gap='- ', color='gray', gap_color='white', symbols=False, symbol_color='black', symbol_gap_color='black', symbol_size=None, scale_symbol_size=1, symbol_kw=None, fts=None, fts_display='facecolor', fts_colorby='type', fts_color=None, fts_color_gap_alpha=1, fts_alpha=None, fts_box_groups='type', fts_box_lw=5, fts_box_kw=None, show_spines=False, spine_offset=None, xticks=True, dpi=None, transparent=None, bbox_inches=None, show=False, **kw)[source]
Plot an alignment
- Parameters:
seqs – sequences
fname – The filename if saving the plot, the figure will be closed afterwards, default: do not save the plot and return figure
ax – The ax to plot in, default: create a new ax
figsize – The size of the created figure, only applies for
ax=Noneextent – The extent of the plotted alignment in data coordinates
[xmin, xmax, ymin, ymax], the default plots each symbol and sequence at integer coordinatesaspect – Wether to shrink the axis to guarantee the given aspect ratio, default no shrinkage,
aspect=2gives visually appealing plots if symbols are also plotted.gap – The characters recognized as gaps, default is
'- 'color – The background color, might be any constant color (defaults to
'gray'), a list of colors, or None for the default matplotlib color cycle, a dictionary mapping the alphabet to colors, or a supported color scheme, seeget_color_scheme(), e.g.'flower'.gap_color – The color of gaps, default is
'white'symbols – Wether to plot symbols (letters), default
Falsesymbol_color – The color of the symbols, takes the same values as the color parameter, default is
'black'symbol_gap_color – the color of the gap symbol, default is
'black'symbol_size – The font size of the symbols, by default a visually appealing size is calculated
scale_symbol_size – Scale factor for the automatically calculated symbol size, default is 1
symbol_kw – A dictionary of additional parameters passed to matplotlib’s
annotate()fts – Wether to highlight features, defaults to no highlighting, might be a FeatureList object or just True to use the features which are attached to the sequences object.
fts_display – How to display the features, one of
'facecolor'(default) and'box', boxes will range over all sequencesfts_colorby – How to define the color of the features, might be any key in the metadata, defaults to
'type', but can also be a function taking a Feature and returning an identifierfts_color – The color of the features, similarly as with the color parameter, this might be a constant color, a list of colors, or None for the default matplotlib color cycle (the default), or a dictionary mapping the feature identifiers to colors.
fts_color_gap_alpha – The alpha value of the feature color for gaps (default: 1)
fts_alpha – Transparency of the features
fts_box_groups – For the
fts_display='box'option, we need to specify which features belong into the same box, this parameter can be a list of FeatureList objects, alternatively this parameter is passed toFeatureList.groupby()to define the groups, defaults to'type'fts_box_lw – linewidth of the the boxes, default: 5
fts_box_kw – Dictionary of additional parameters passed to matplotlib’s
Rectangleto create the feature boxesshow_spines,despine_offset – Parameters passed to seaborn’s despine function, the default
show_spines=Falseremoves axes spinesxticks – True leaves the xticks (default), False turns them off, can also be a list of xticks
dpi,transparent,bbox_inches – Parameters passed to
savefig()if the figure is savedshow – True shows the figure, default: False
**kw – Other kwargs are passed to matplotlib’s
pcolormesh()
- Returns:
Axes object if
fname=None, otherwise the figure is saved and closed
Example
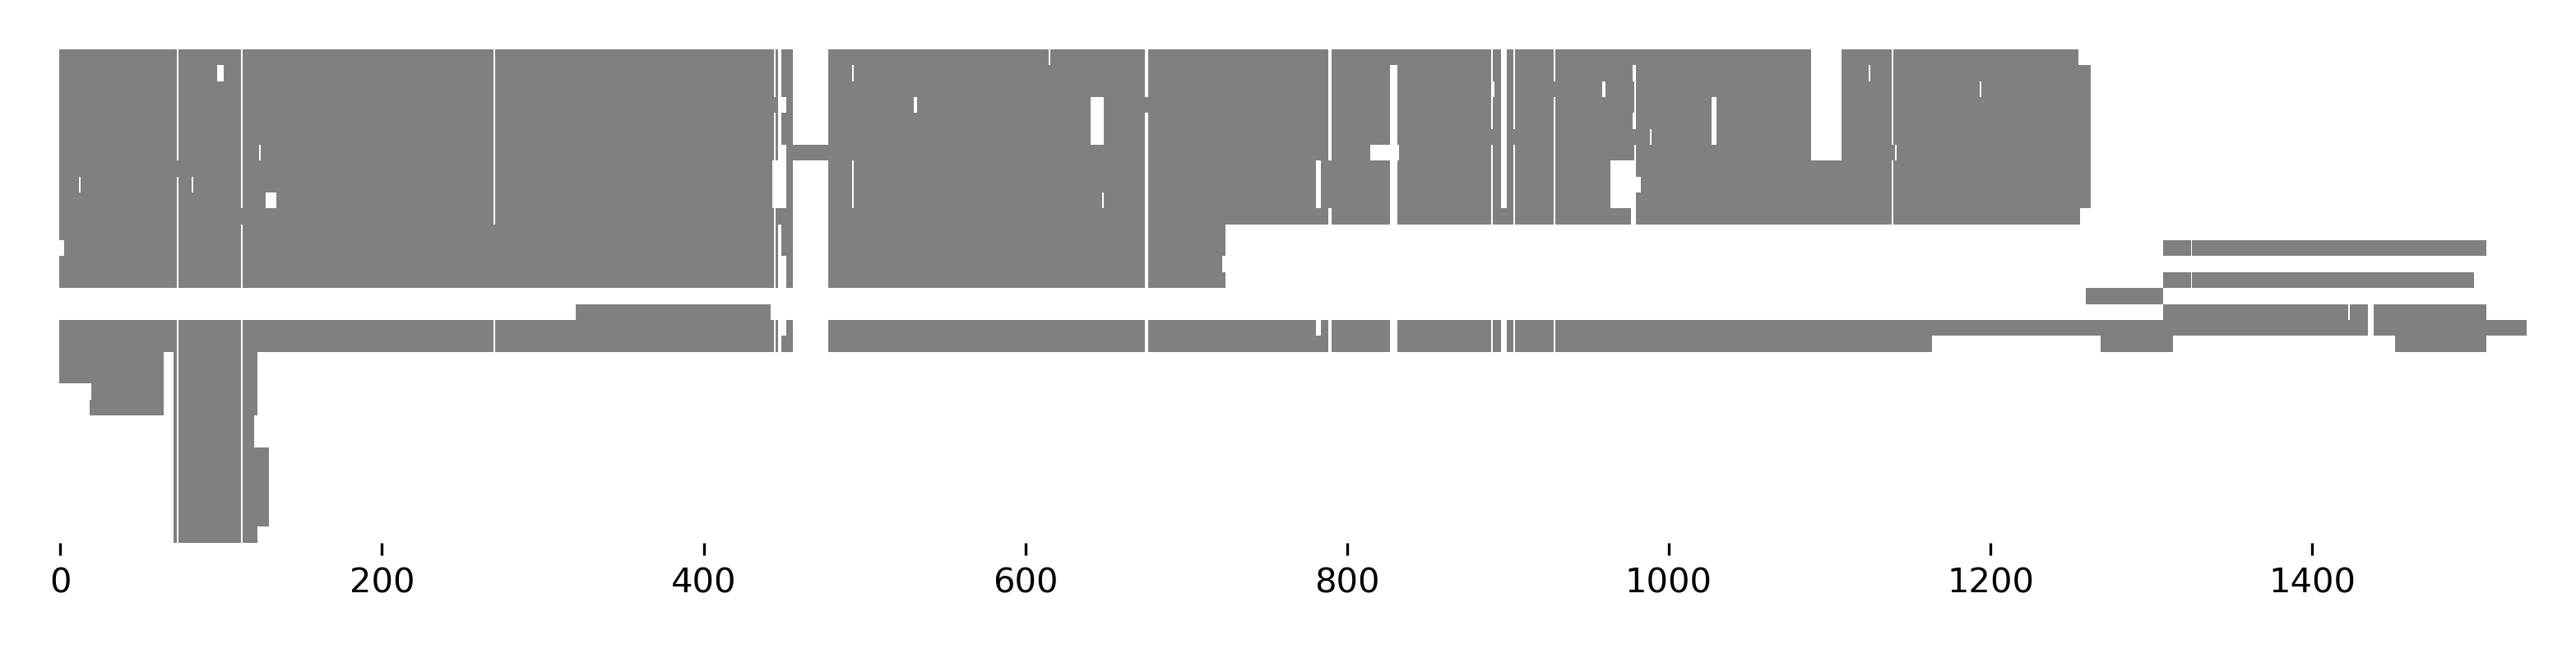
>>> from sugar import read
>>> seqs = read('https://osf.io/download/j2wyv')
>>> seqs.plot_alignment(show=True, figsize=(10, 4))
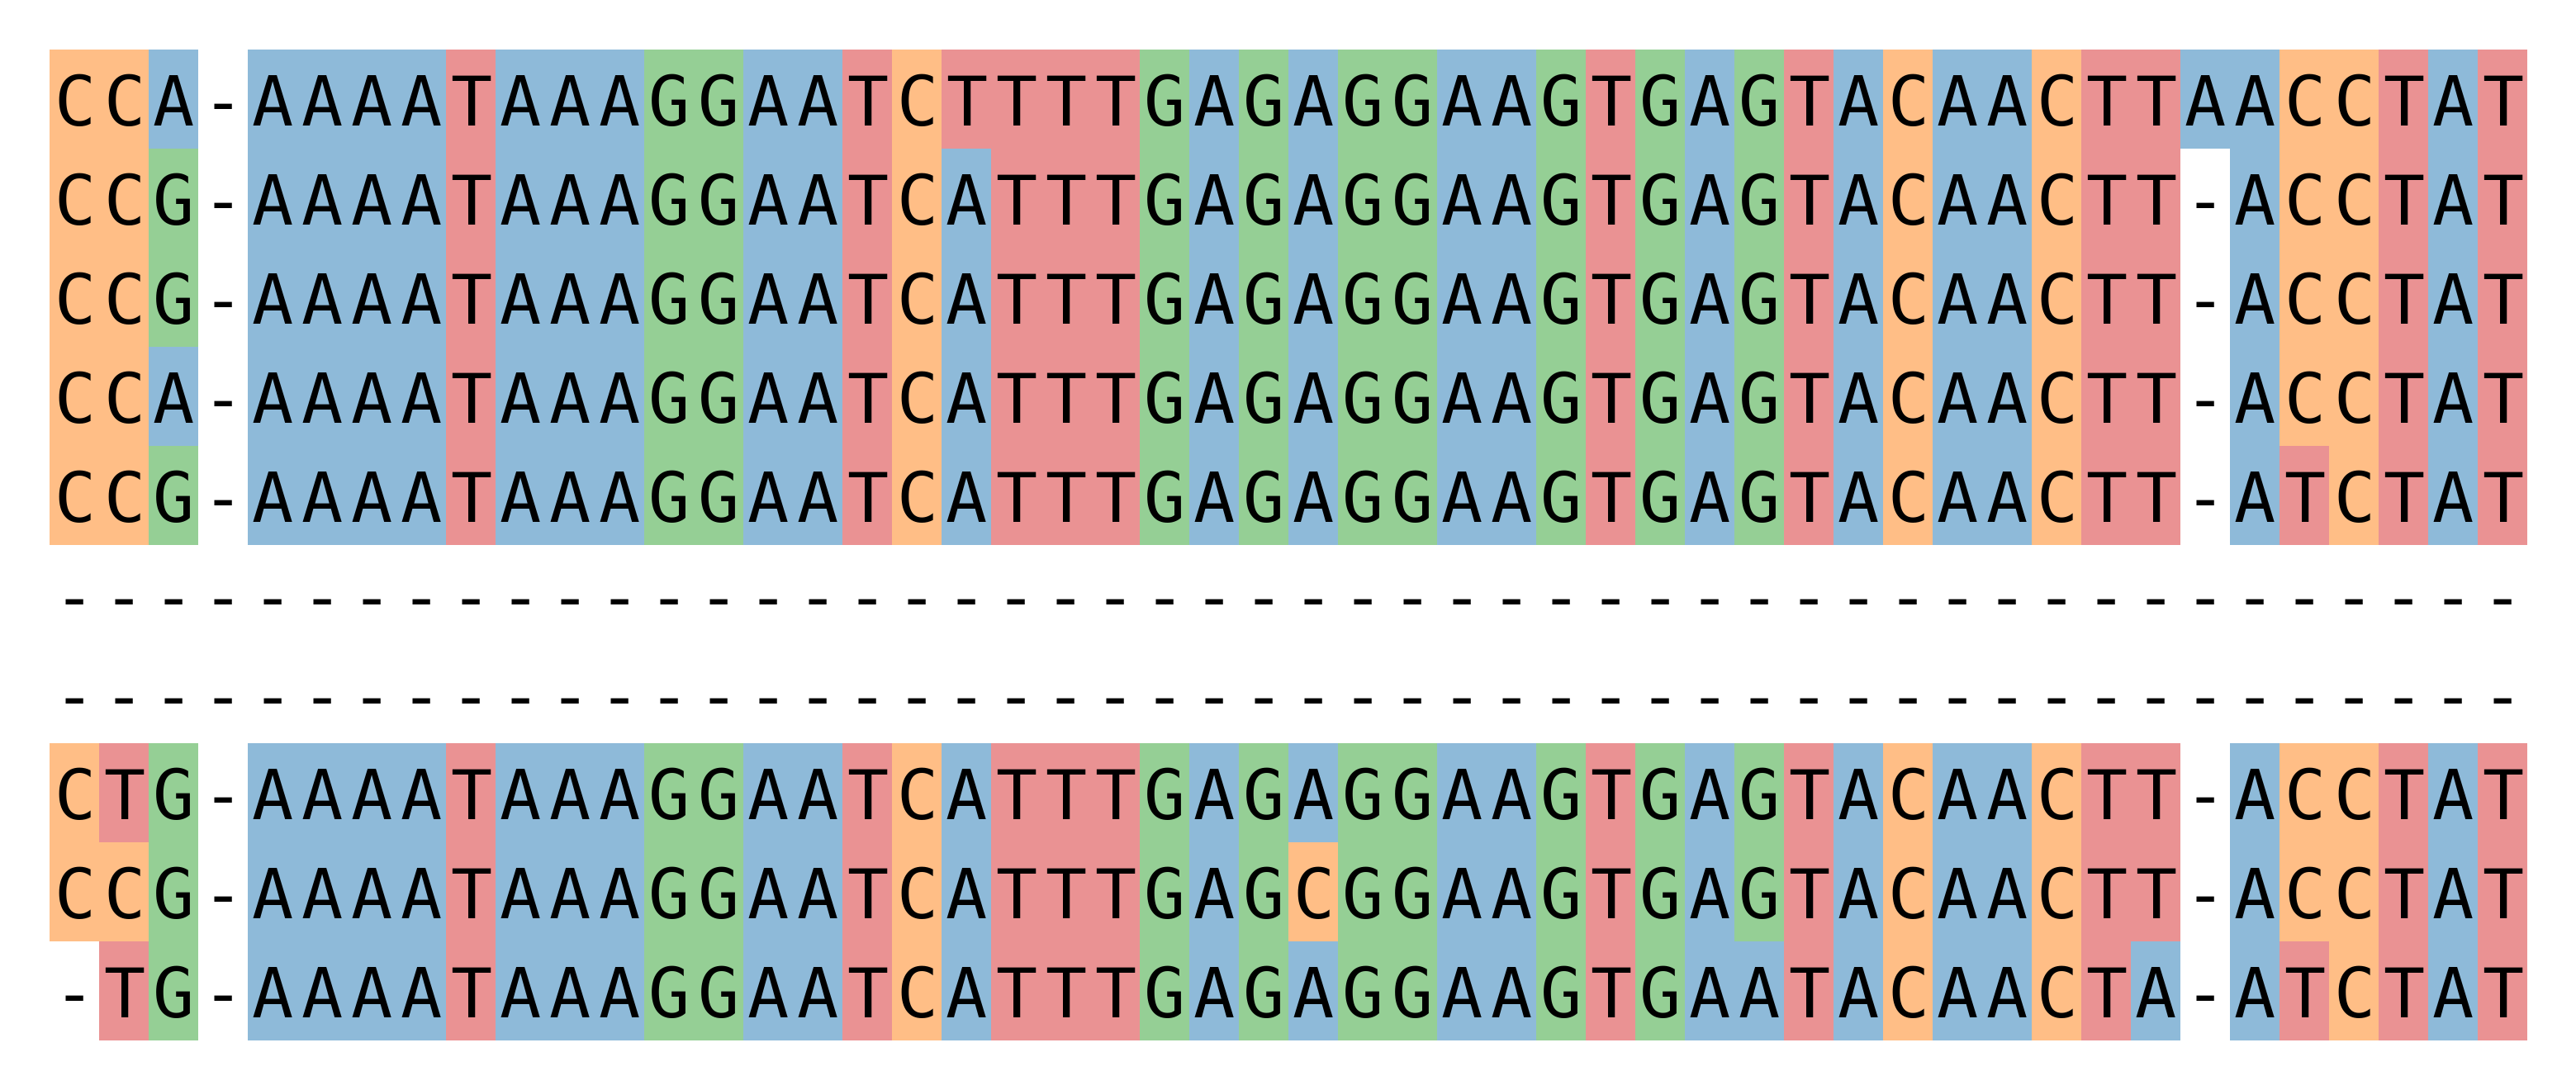
>>> seqs[:, 70:120].plot_alignment(show=True, color=None, figsize=(10,8),
...                                symbols=True, aspect=2, alpha=0.5)
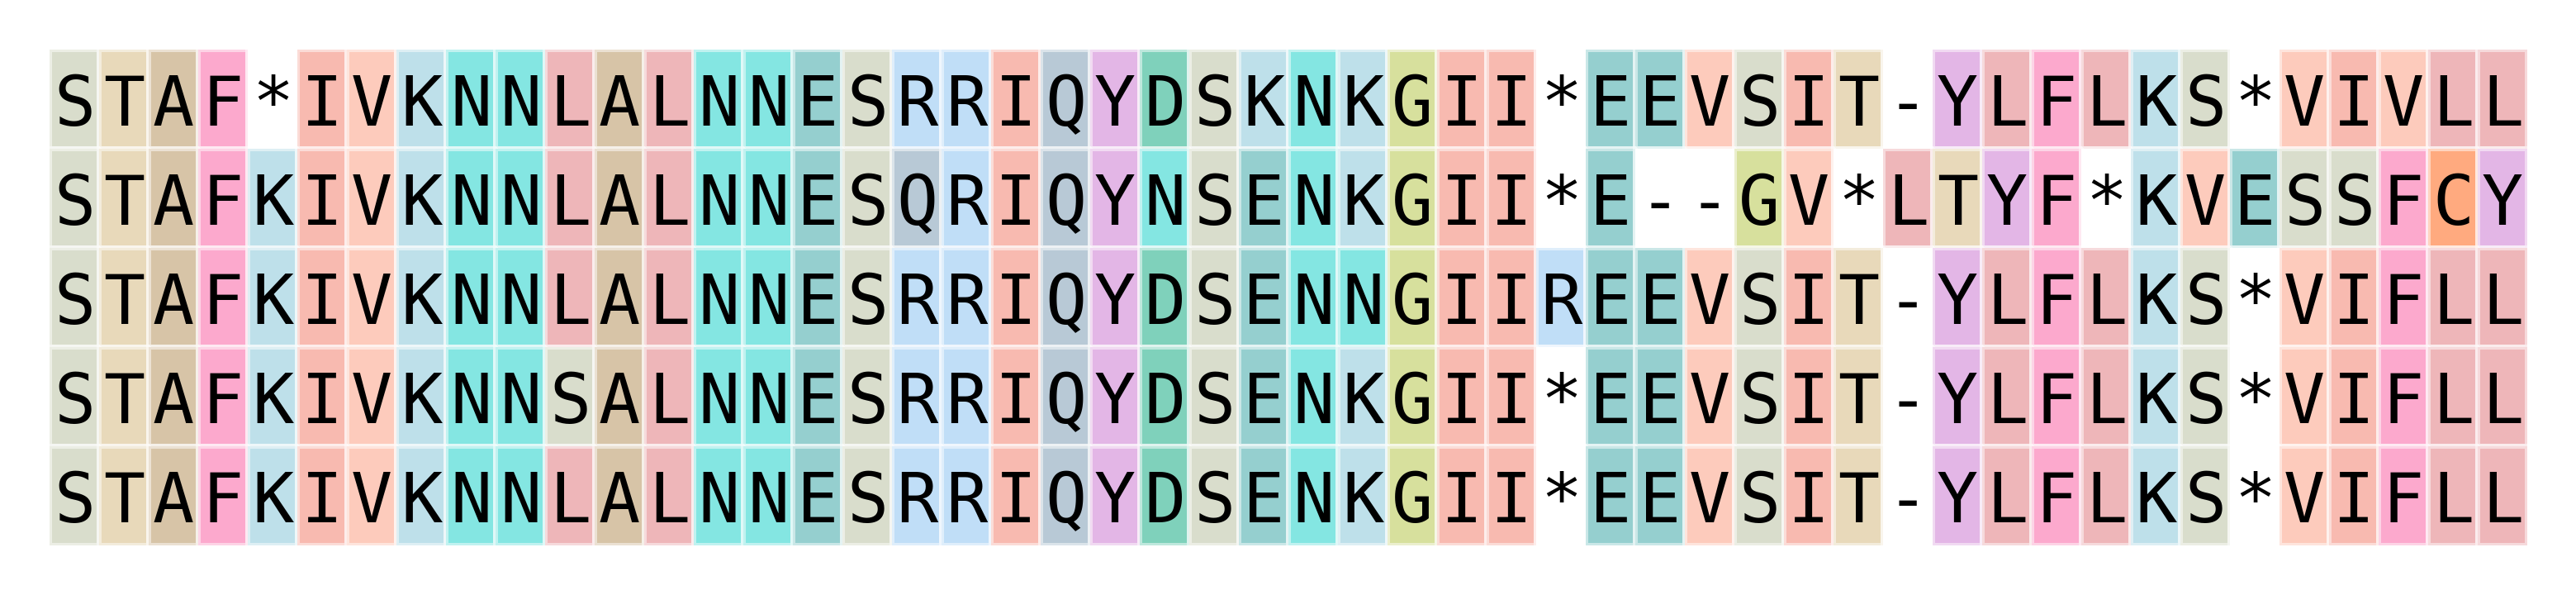
>>> seqs2 = seqs[:5, :150].copy()
>>> seqs2.translate(complete=True).plot_alignment(
...     show=True, color='flower', figsize=(10,8),  symbols=True,
...     aspect=2, alpha=0.5, edgecolors='w')
- sugar.imaging.ftsviewer.plot_ftsviewer(fts: FeatureList, fname=None, *, seqs=None, groupby='seqid', align=None, crop=False, figsize=None, ncols=1, sharex=False, sharey=False, fig_kw={}, ax=None, xticks=False, axlabel=True, axlabel_kw={}, same_colors=True, colorby='type', color=None, dpi=None, transparent=None, bbox_inches=None, show=False, seqlen=None, first_index=None, **kw)[source]
Plot features using DNAFeaturesViewer and
toftsviewer()- Parameters:
fts – features
fname – The filename if saving the plot, the figure will be closed afterwards, default: do not save the plot and return figure
seqs – The corresponding sequences, instance of
BioBasket, will be used to extract the length of each sequence, they are also needed when theplot_sequenceoption is used.groupby – Features are grouped by this key, see
groupby(), and each group is plotted in a separate ax, defaults to'seqid'.align – Align features by this method or list of features, can be one of the strings
'center','first','last', or a list or BioBasket of features to align each group to the the first found feature in the list. By default no alignment is done. If align is used, you should setsharex=True.crop – If align is used, crop the sequence lines to the first and last feature in each group, can be
Trueto crop to the minimal region including all features, or an integer to add some extra space before the first features.figsize – The size of the created figure, by default a reasonable value is calculated with
(6 * ncols, 2 * nrows), has to be tuned for non-usual cases.ncols – Number of columns in the figure, by default all groups are plotted in a single column
sharex,sharey – parameters passed to
plt.subplotsfig_kw – dict of other parameters passed to
plt.subplotsax – Instead of specifying the figure with figsize, etc. one may pass an axes instance to draw the annotation in, make sure to only have a single annotation group
axlabel – Plot the name of each group in the axis, default: True
axlabel_kw – Dict of corresponding options passed to
annotate()same_colors – Wether to use the same color mapping in all subplots, default True.
dpi,transparent,bbox_inches – Parameters passed to
savefig()if the figure is savedshow – True shows the figure, default: False
seqlen – Can be used to set the sequence length if not using
seqs.first_index – Can be used to set the sequence start index (where the line representing the sequence starts), for aligned features this is determined automatically. If the parameter is set, it overrides the automatic detection. Can be either an int or a dict mapping group keys to first indices.
**kw – Other kwargs are passed to
toftsviewer(),GraphicFeatureorGraphicRecordorCircularGraphicRecord, andGraphicRecord.plot().
- Returns:
Figure object if
fname=None, otherwise the figure is saved and closed
Example
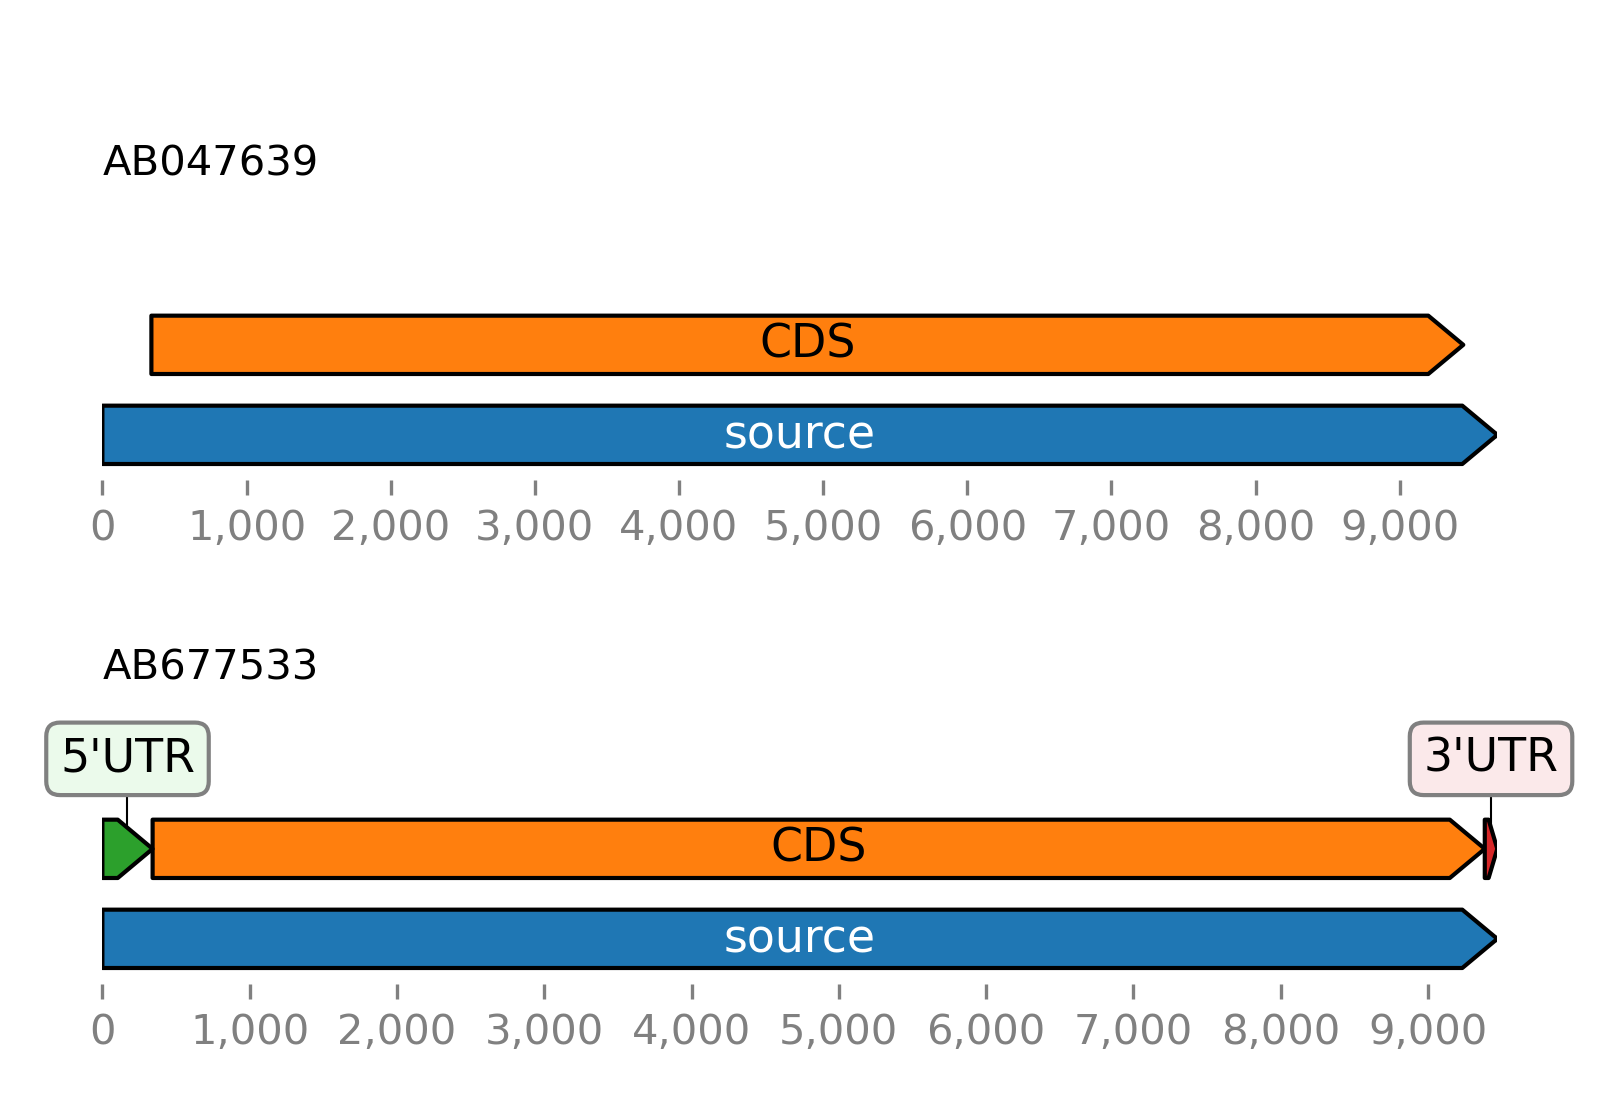
>>> from sugar import read
>>> seqs = read()
>>> seqs.plot_ftsviewer()
- sugar.imaging.colors.get_color_scheme(name)[source]
Return color scheme
- Parameters:
name – Name of the color scheme, the following color schemes are supported out of the box:
autumn, blossom, buried, clustalx, clustalx_nt, flower, hydrophobicity, ocean, prophelix, propstrand, propturn, rainbow, rainbow_nt, spring, sunset, taylor, wither, zappo. These color schemes originate from Biotite (Gecos), Jalview and ClustalX, see here for a description. Alternatively, a JSON file, as generated by the Gecos library can be specified. Acolorsentry with a letter->color mapping in the JSON file is sufficient.- Returns:
Dictionary with letter->color mapping