Plotting alignments
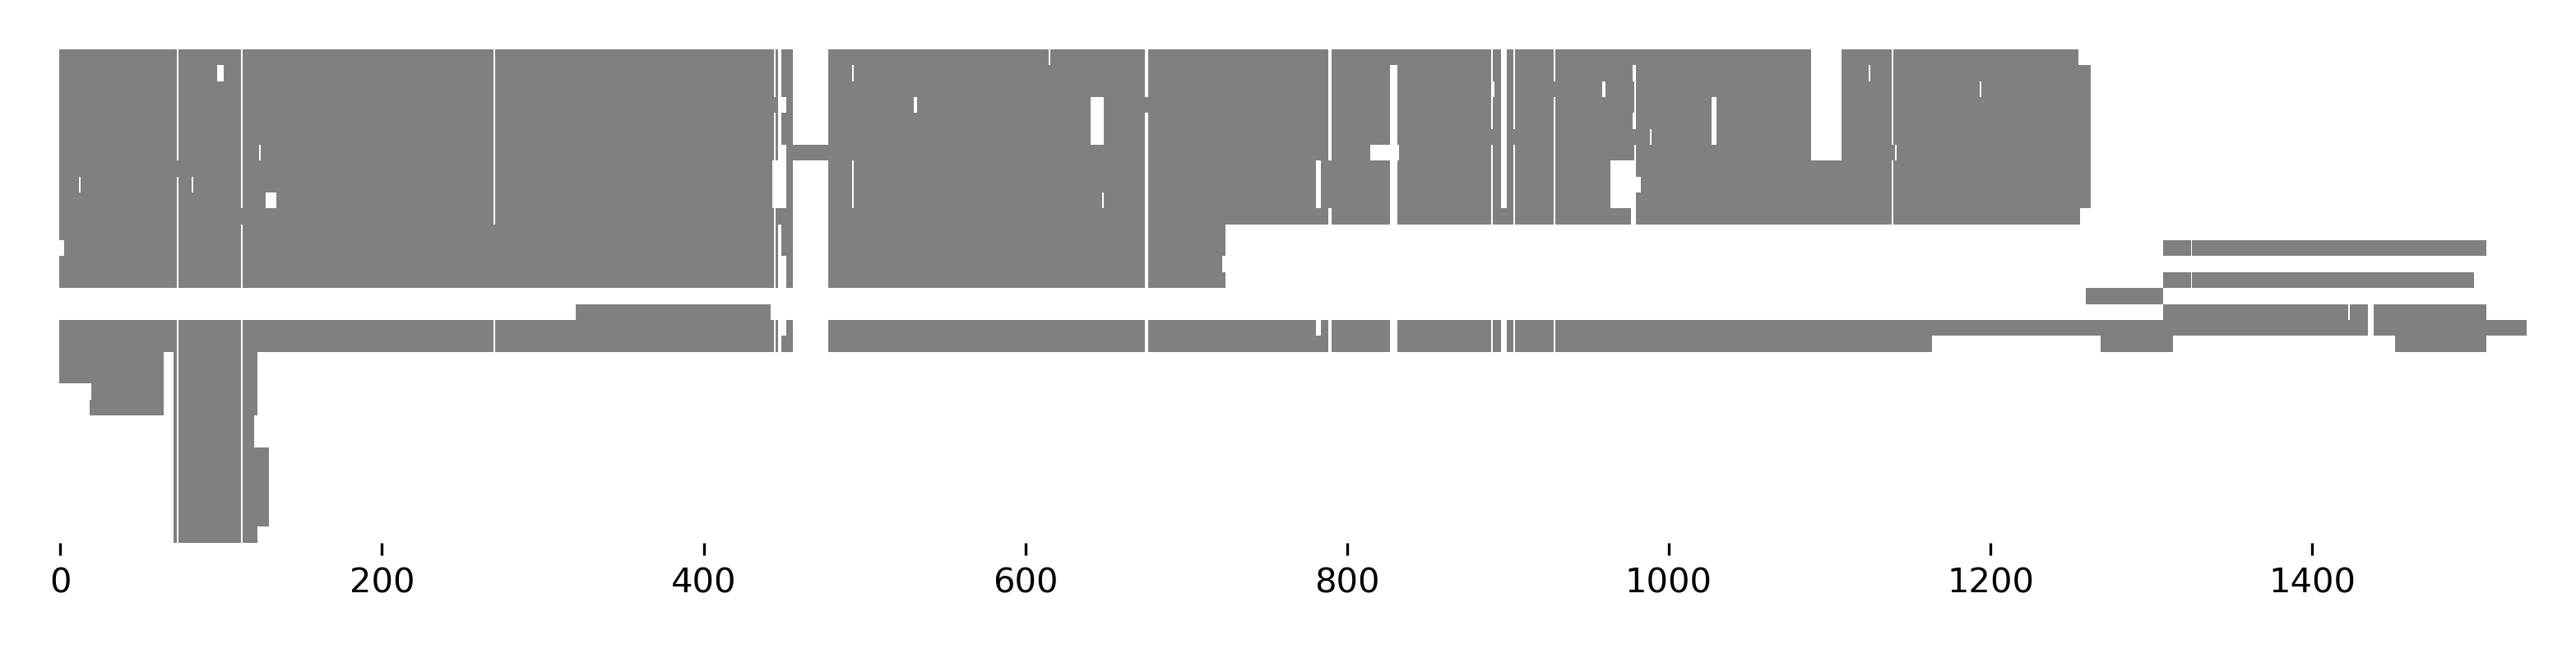
Alignments can be plotted using the BioBasket.plot_alignment() method.
>>> from sugar import read
>>> seqs = read('https://osf.io/download/j2wyv')
>>> seqs.plot_alignment(show=True, color='gray', figsize=(10, 4))
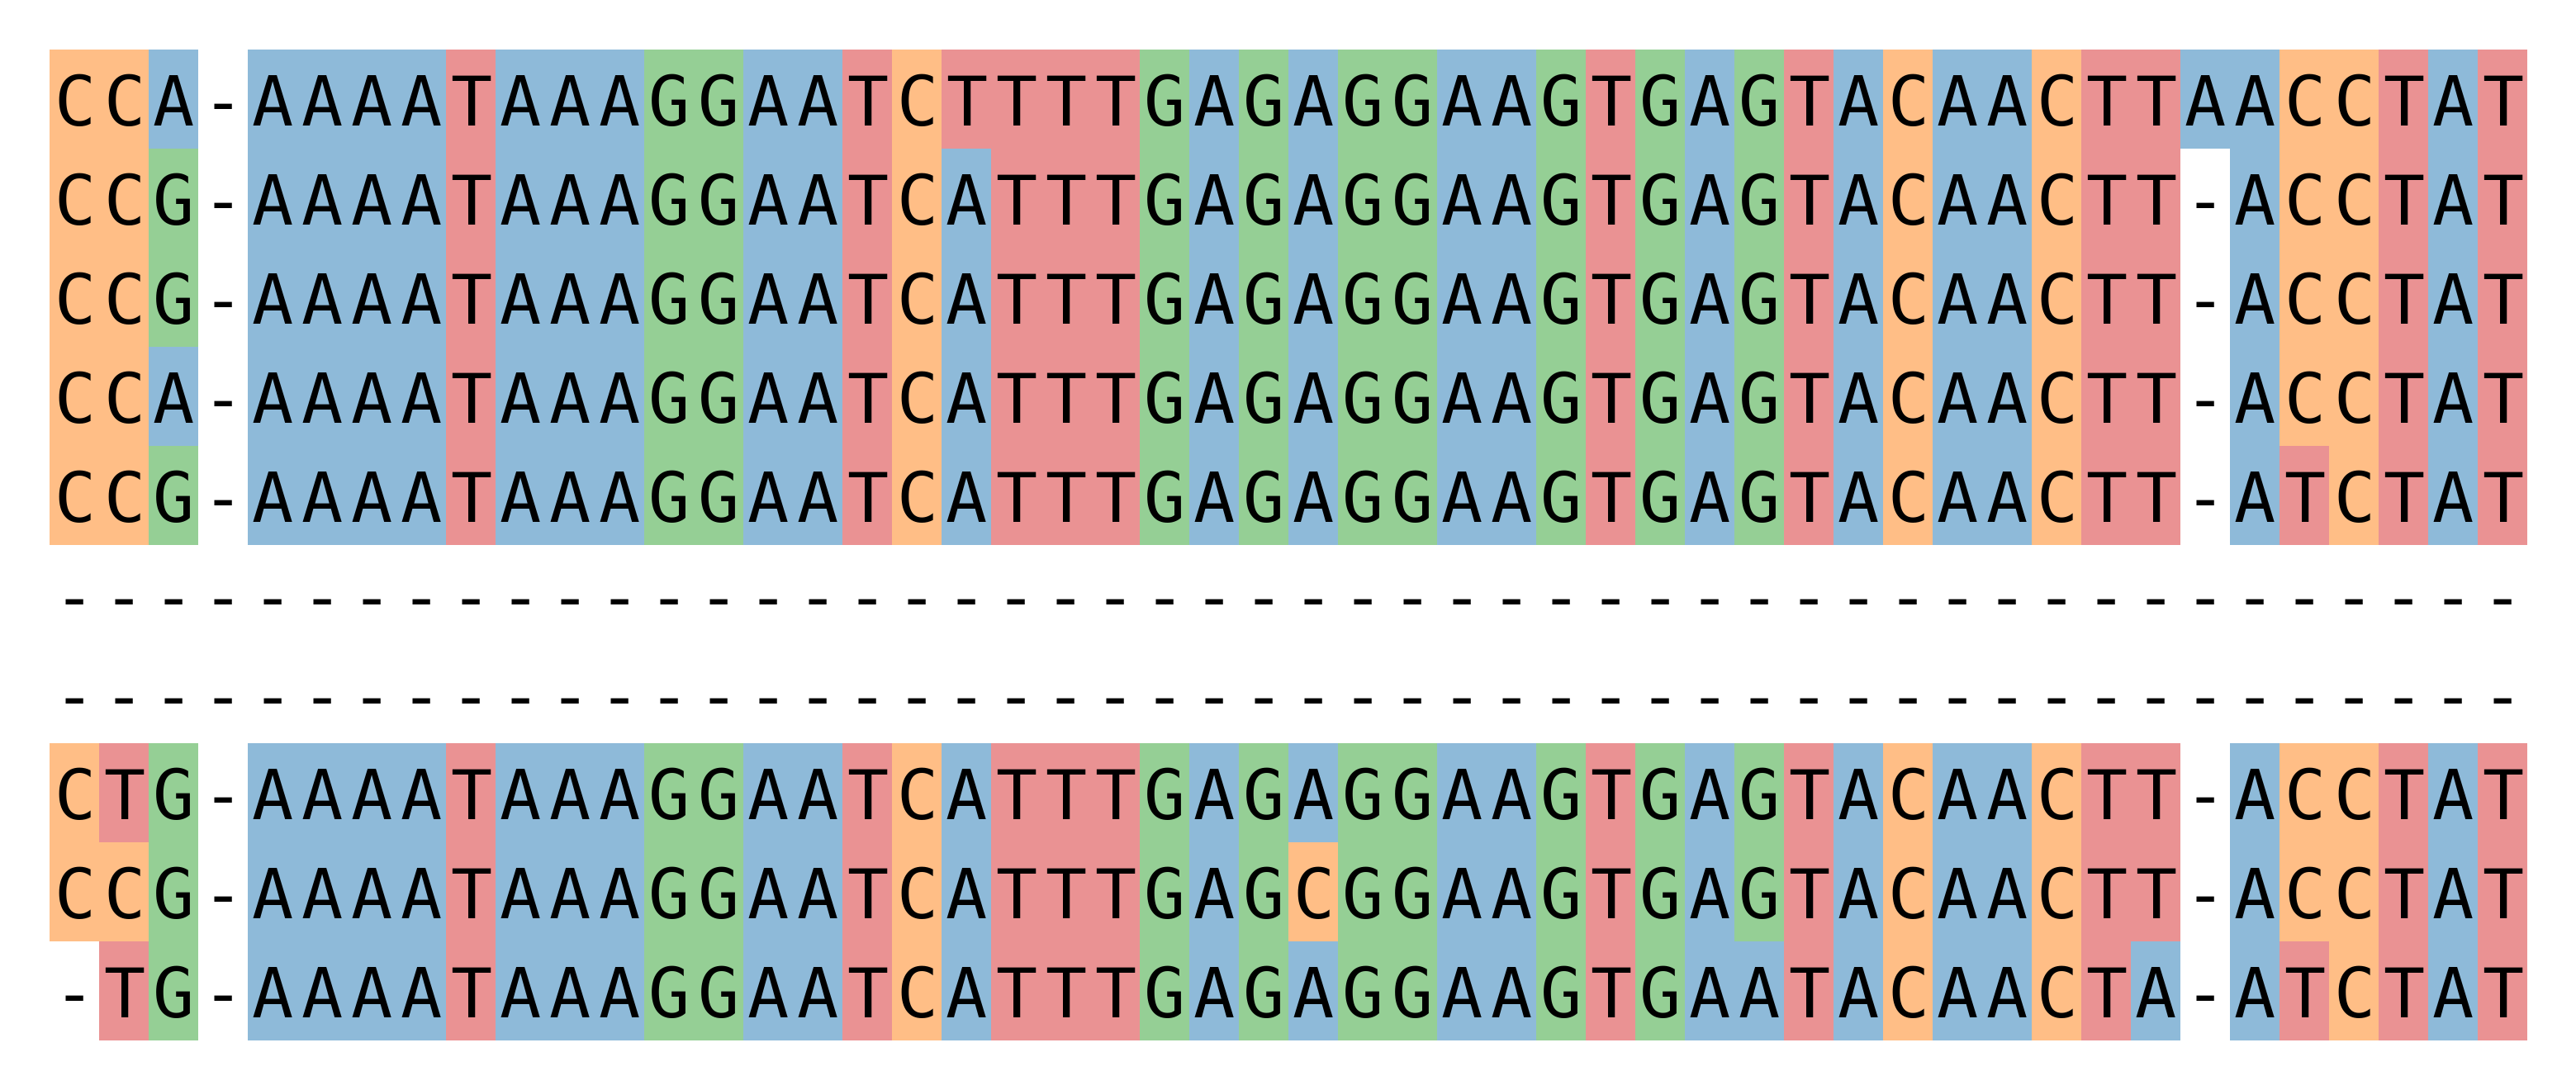
>>> seqs[:, 70:120].plot_alignment(fname='ali.pdf', color=None, figsize=(10,8),
...                                symbols=True, aspect=2, alpha=0.5)
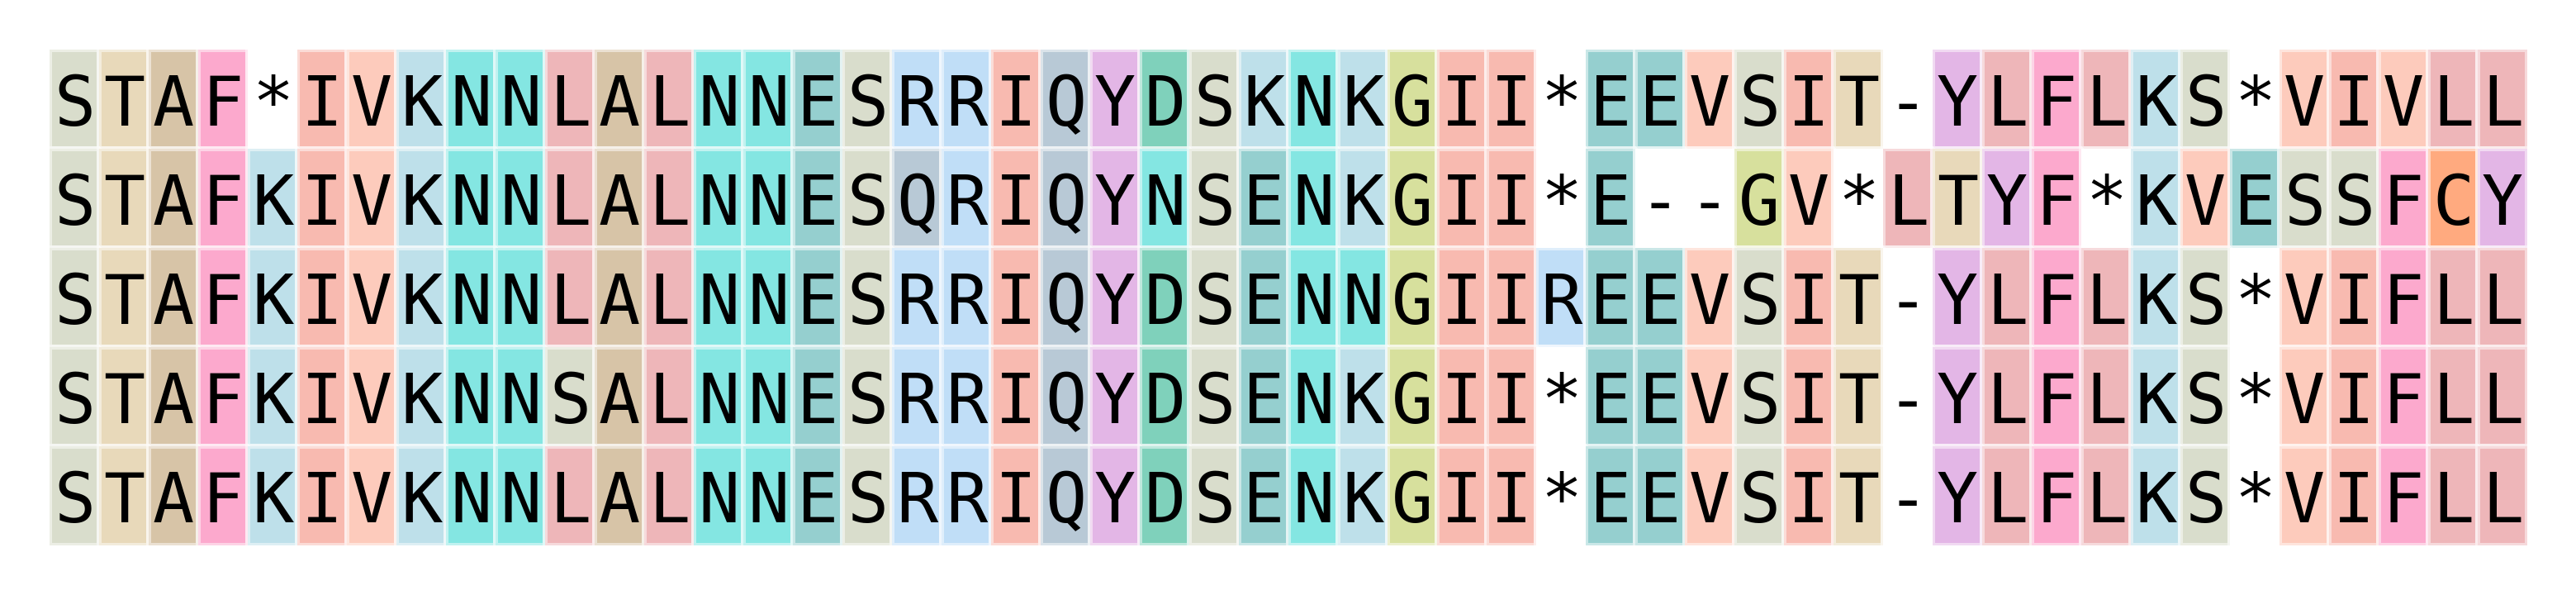
The following example shows an alignment of amino acids
using the 'flower' color scheme, a color scheme that
displays amino acids with a high BLOSSUM62 score in similar colors.
Color schemes originate from Biotite (Gecos), Jalview and ClustalX,
see here for an overview.
The available color schemes are listed in get_color_scheme().
>>> seqs2 = seqs[:5, :150].copy()
>>> seqs2.translate(complete=True).plot_alignment(
...     show=True, color='flower', figsize=(10,8),  symbols=True,
...     aspect=2, alpha=0.5, edgecolors='w')
The plotting function has many options,
including marking of plotting feature regions with different colors.
Multi-line plots are not supported.
If you need these, consider converting the sequences to a biotite Alignment object via
seqs.tobiotite(msa=True)
and using
Biotite’s plotting capabilities.
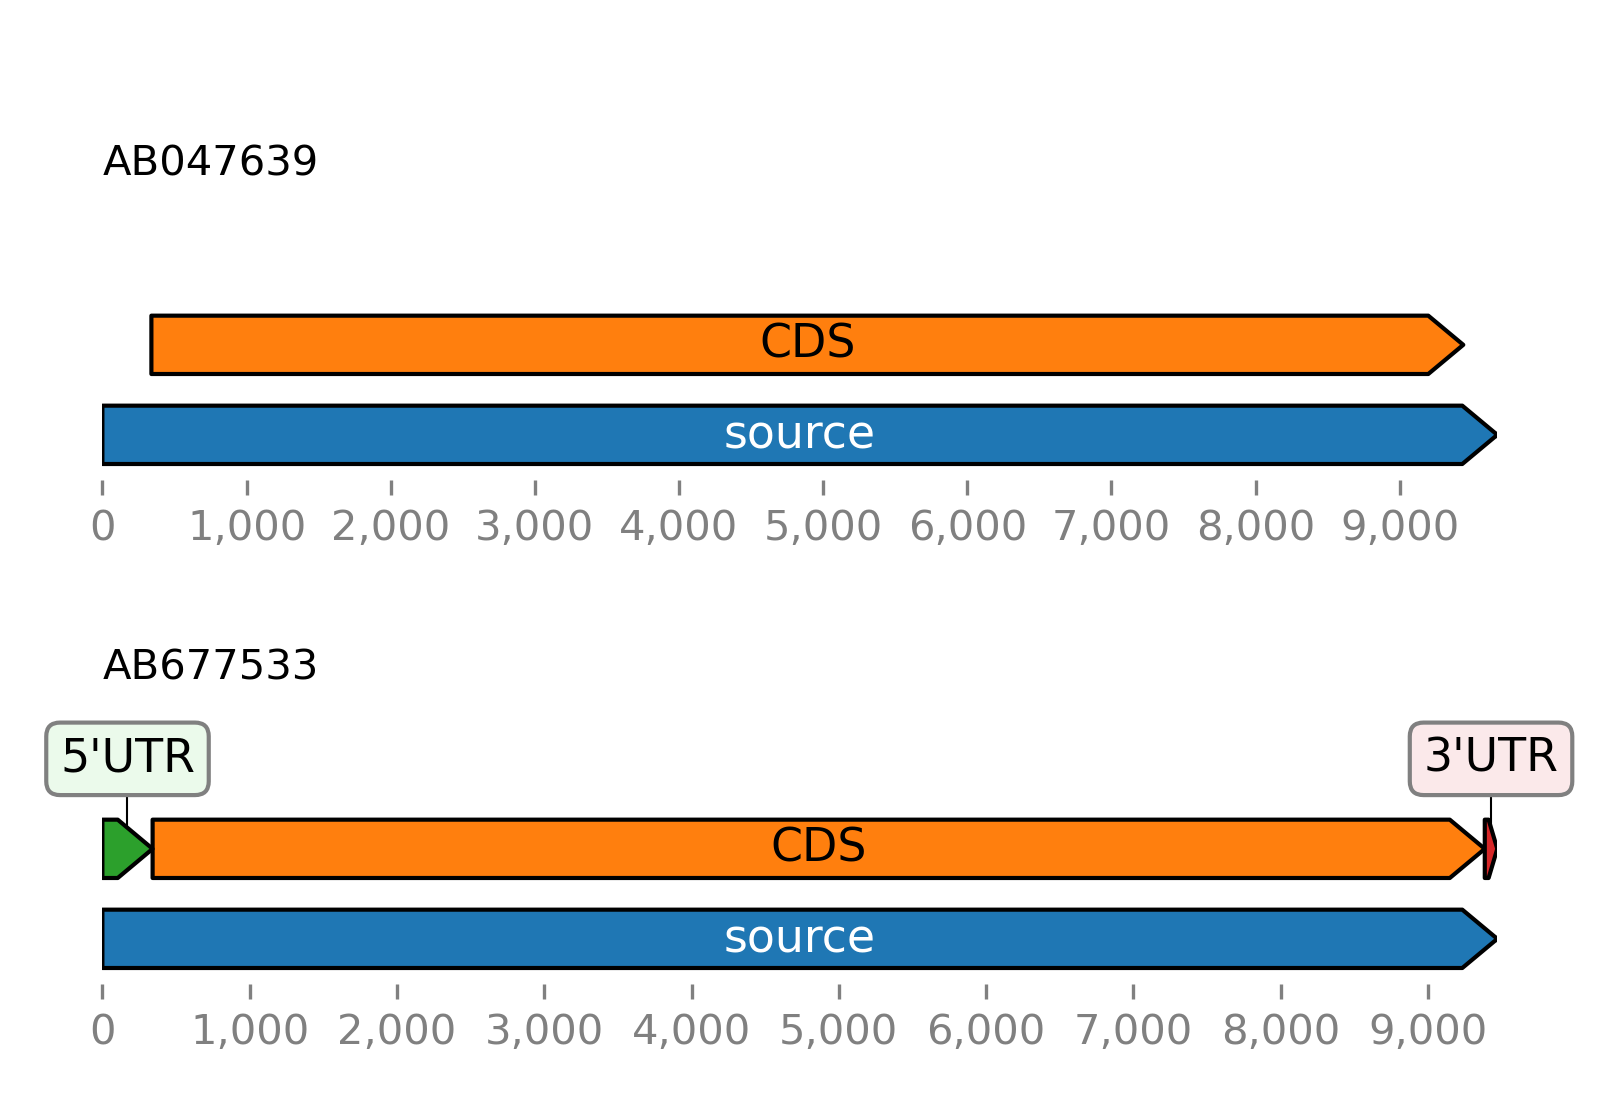
Plotting features
Sugar can plot features with DNAFeaturesViewer.
Use the plot_ftsviewer() method of
FeatureList,
BioBasket, or
BioSeq.
Plot the features of the example sequence:
>>> from sugar import read
>>> seqs = read()
>>> seqs.plot_ftsviewer(show=True)
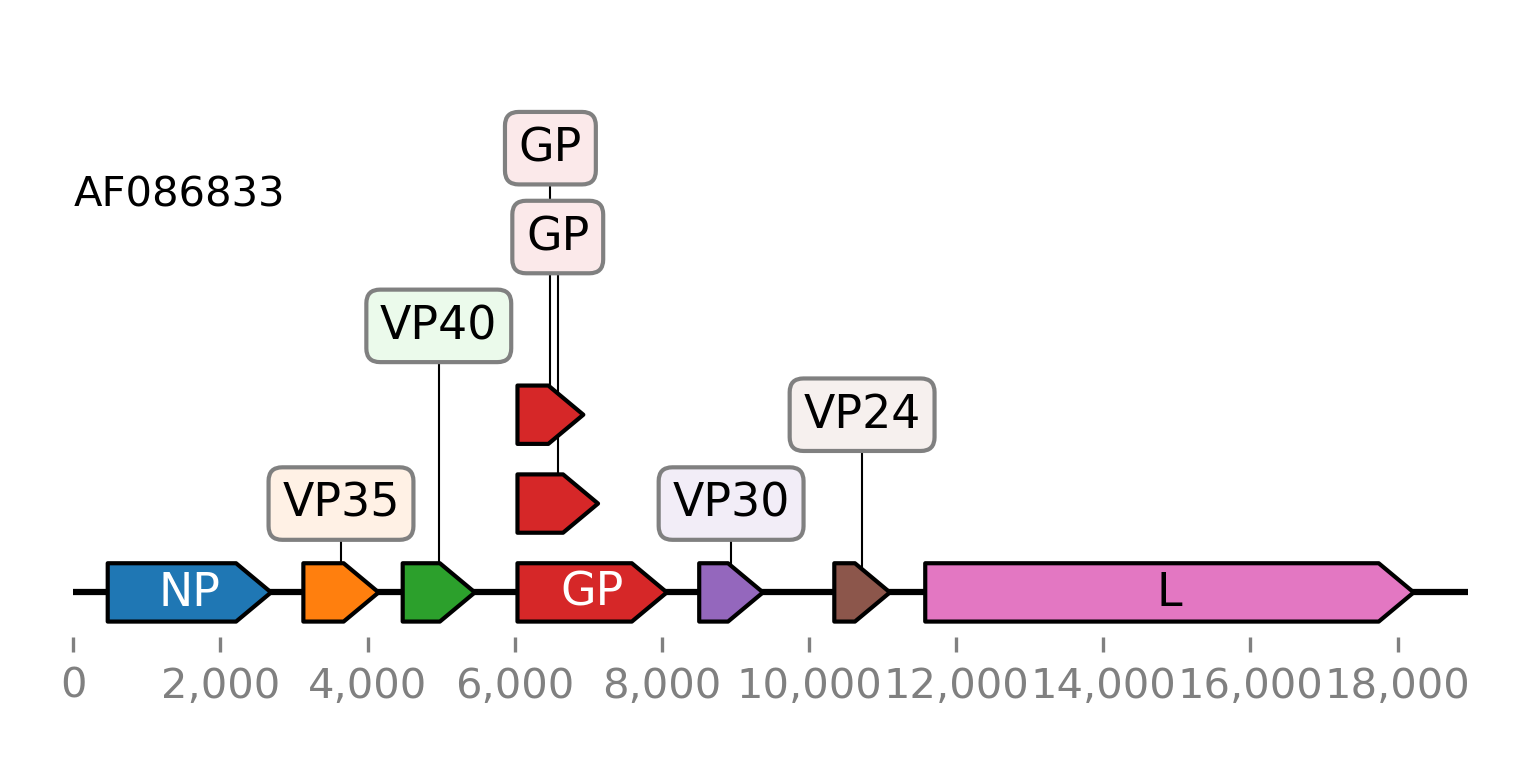
Here is another example of plotting the CDS features of an Ebolavirus RNA. The GenBank file is included in the provided tutorial files. It is downloaded again here using the Entrez client.
>>> from sugar.web import Entrez
>>> client = Entrez()
>>> seq = client.get_seq('AF086833')
>>> fts = seq.fts.select('cds')
>>> for ft in fts:
...    ft.meta.name = ft.meta._genbank.gene
>>> fts.plot_ftsviewer(colorby='name', seqlen=len(seq), figsize=(6, 2.5), show=True)
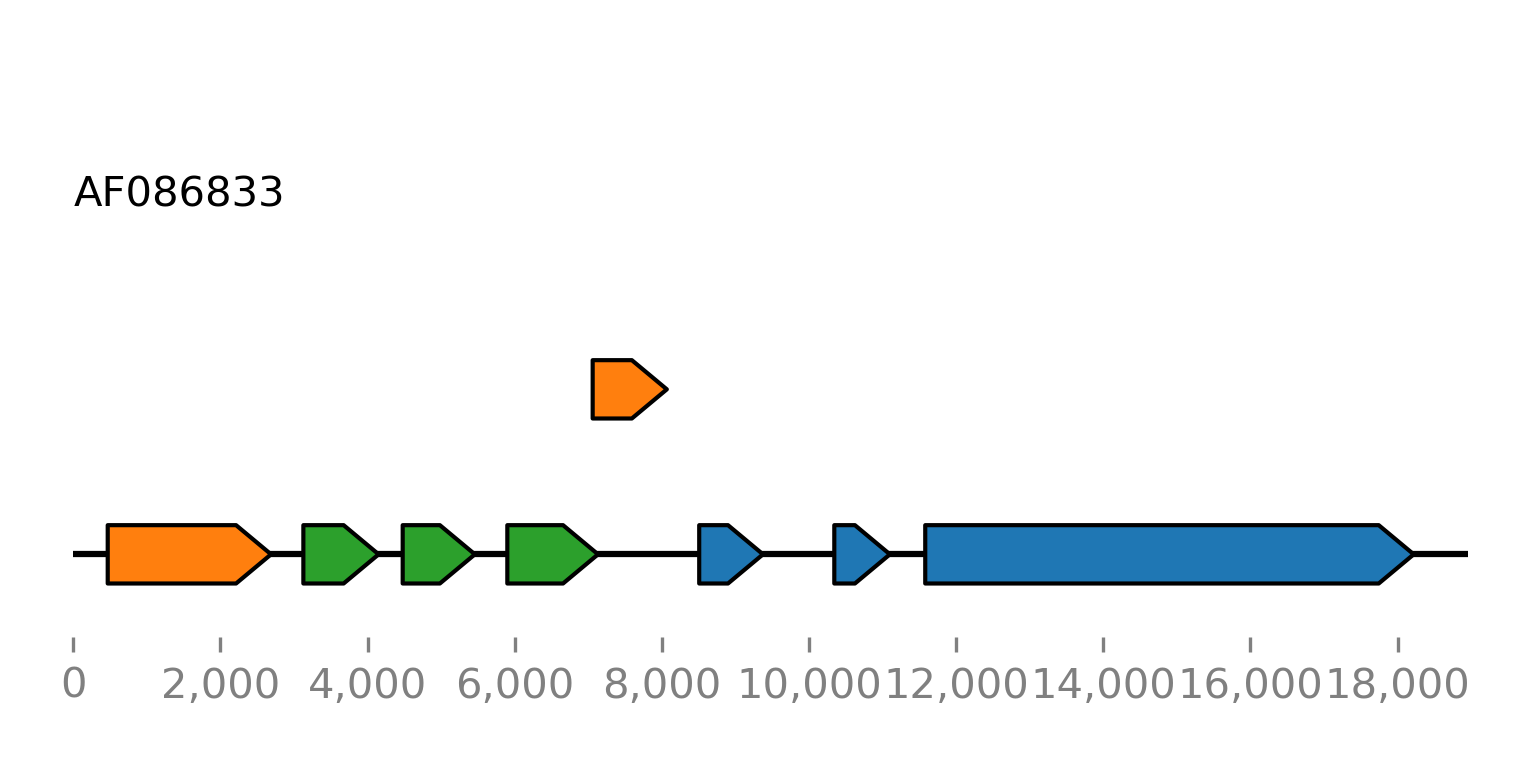
For comparison we plot all open reading frames with a minimum length of 500 nucleotides:
>>> orfs = seq.find_orfs(len_ge=500)
>>> orfs.plot_ftsviewer(colorby='rf', label=None, seqlen=len(seq), figsize=(6, 2.5), show=True)
Note
Use the colorby option to specify the category by which the features will be colored.
Use the color argument to specify the colors used. See toftsviewer().
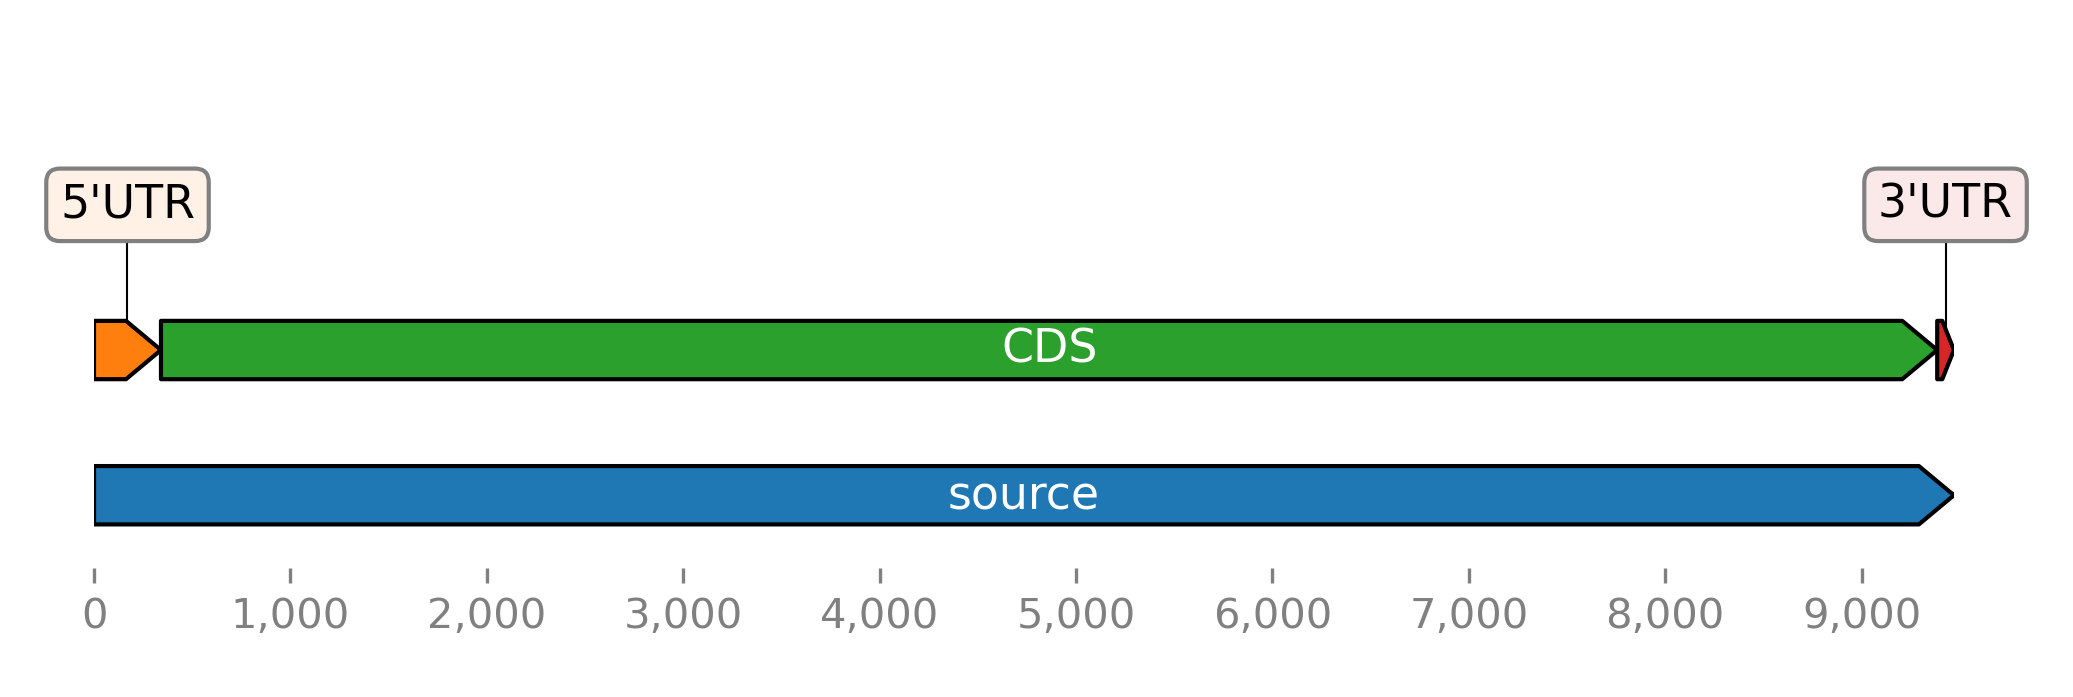
If you want more fine-grained control you can convert features to
a GraphicRecord object with the
toftsviewer() method and use the
plotting method of the returned object:
>>> seqs = read()
>>> record = seqs[1].toftsviewer()
>>> record.plot()
Note
Using BioSeq or BioBasket.plot_ftsviewer()
over FeatureList.plot_ftsviewer() has the advantage,
that sequence lengths are used automatically.